Climate projections
Projecting climate over the course of the 21st century involves several unknowns. First is how humans will continue to modify climate through greenhouse gas emissions and land use change. This is a sociopolitical question that depends on global population, how energy is derived and globalization. Scientists have come up a set of potential pathways of human intervention on climate by considering several trajectories called representative concentration pathways or RCPs. RCPs are viewed in terms of the net change in Watts per meter square through combined anthropogenic factors by the year 2100.
Emission Scenarios
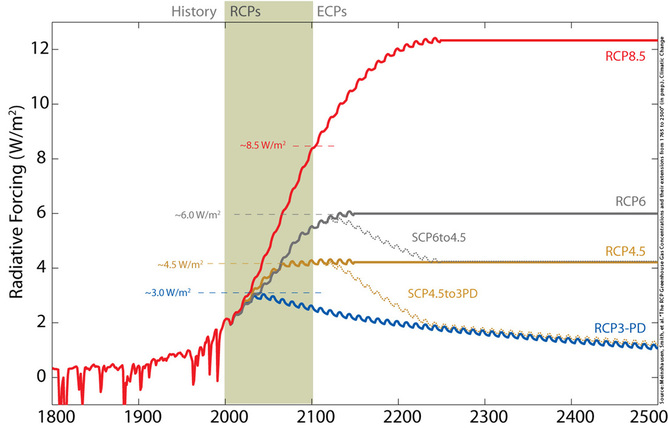
From 1850 through today, the net effect of mankind on the global surface energy balance has been to add an addition 1.8 Watts per square meter to the surface. Most of this coming from increases in carbon dioxide and methane. By comparison the projections for the 21st century are significantly larger and feature RCP8.5 and RCP4.5, or 8.5 and 4.5 Watts per square meter energy trapped in the Earth system. RC8.5 is a business as usual trajectory, whereas RCP4.5 involves significant change in how energy is derived as well as carbon sequestration.
Global Temperature Projections
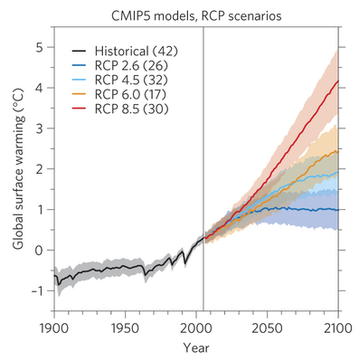
These experiments have been run by numerous models from scientific groups across the globe. Since each model simulates climate in different ways, changes are viewed by examining the average model response as well as its spread. To the left are projected changes in global mean temperature through 2100. Recall that we have observed a global increase in temperature of 0.8C since 1850 as shown by the black line. The changes for the 21st century are more pronounced with RCP8.5 showing a 4C warming, while RCP4.5 shows a warming of about half that. While 4C may not seem like much to you since daily temperature changes far more than that, recall that the change in global temperature from the last ice age to today is about 6C.
Geographic projections of change
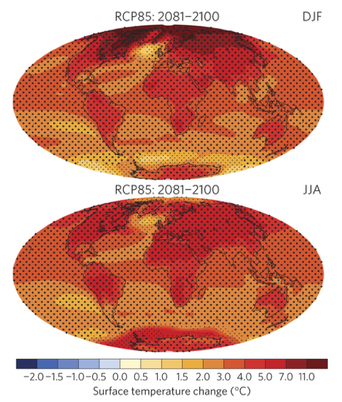
Warming over the past century has not been spatially uniform, and likewise warming projected over the 21st century is expected to show strong geographic and seasonal patterns. The images to the left show projected changes in December-February (top) and June-August (bottom) temperature between the last two decades of the 21st century and the late 20th century. What patterns do you see? Can you think of what processes might explain them?
Climate change is more than global warming
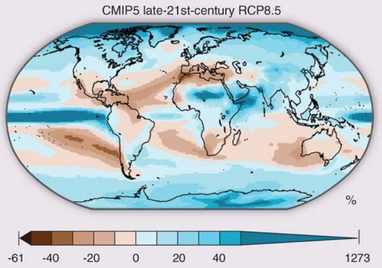
A warmer planet results in a cascades of additional changes in climate. Projected changes in precipitation contain significant latitudinal structure. The overall increase in evaporation rates with warming and increase in water holding capacity of the atmosphere leads to a wetter planet, particularly at high latitudes. However, regions just poleward of subtropical deserts including much of the southwestern US, the Mediterranean and Australia all are expect to dry.
Projected changes for the Pacific Northwest
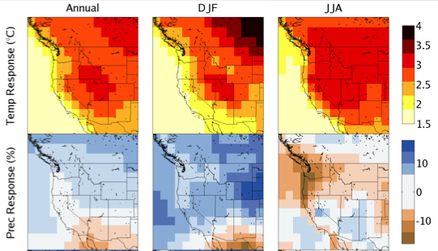
Honing in on the Pacific Northwest we again find warming across all seasons. To the left here are projected change circa 2031-2060 for RCP8.5 for the annual mean (left), December-February (middle) and June-August (right). Warming is slightly stronger during the summer months. Slight increases are projected for precipitation annually, with most of the increase coming in the winter and spring, with decreases in summer rainfall.
Check out the following website where you can visualize projected change in temperature and precipitation: http://www.climatewizard.org
Check out the following website where you can visualize projected change in temperature and precipitation: http://www.climatewizard.org
Mountain snowfall
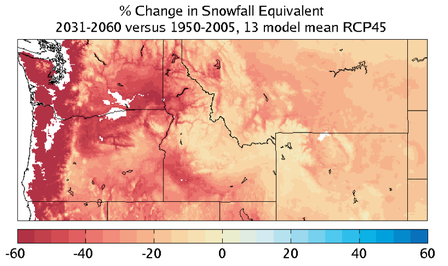
Despite overall increases in the amount of precipitation projected in a warming planet for the Northwest, the overall rise in temperature will result in far less precipitation falling as snow, being stored in mountain snowpack and providing much needed water during the warm season. Here we see that much of the lower-elevation mountains including parts of the Cascades and Northern Rockies are projected to see declines in winter snowfall of 25-50% by mid-21st century. The changes are far less extreme over the higher terrain of central Idaho and the Yellowstone area. Why do you think this is?
Log in to BBLearn and go to Module 8. Click on the Mastering Assignments icon, and in the Study Area, complete "Assignment 8.3: Climate Projections".
