Net Primary Productivity
Net Primary Productivity is a measurement of carbon uptake through plant growth for an area over one year. NPP is determined by several environmental factors, including temperature, precipitation, soils, latitude, and human impacts.
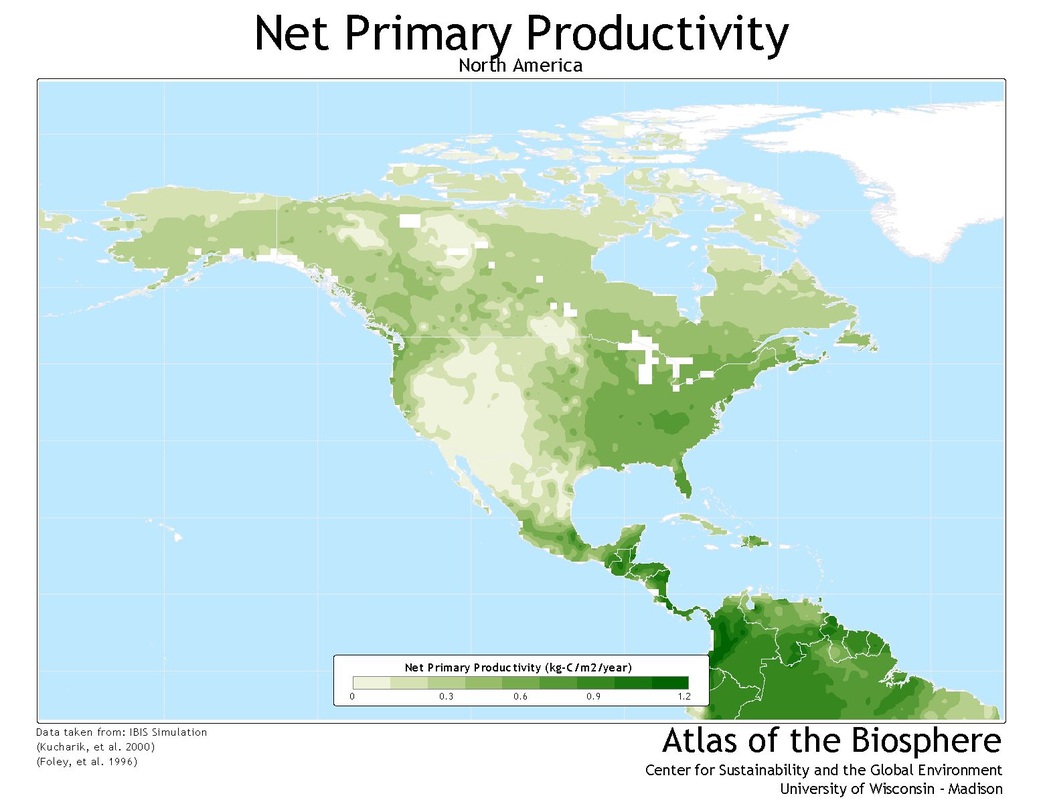
In the map below of average North America NPP, the darker green areas are associated with higher rates of NPP (i.e., more plant growth and carbon uptake), while the lighter areas are associated with less NPP. The white squares around the Great Lakes indicate insufficient data (because plants don't grow in the middle of the Great Lakes!).
Interpret this map to answer the following questions:
1. The highest rate of NPP in the US is in southern Florida, in the Everglades. Does Florida have high or low annual precipitation? Is it a warm place or a cold place? Is there much seasonality in Florida or is it climatically consistent across the year?
2. Which half of the US (western or eastern) has a higher average rate of NPP?
3. Think about the differences in topography and climate across the US. Why do you think that half has a higher rate? What factors are contributing?
The map above is a map of average NPP, but satellites that orbit Earth are measuring NPP across the Earth surface every single day, allowing us to better understand how climate variability and humans impact NPP. The video below is a composite animation of daily NPP data taken by the Moderate Resolution Imaging Spectroradiometer (MODIS) from 2000-2009. Use the animation to answer the following questions:
1. Which hemisphere (northern or southern) has higher NPP? Why? What factors are contributing?
2. Large sections of northern Africa and the middle of Asia are white year-round, meaning they have essentially no plant productivity. These two places are very different, however. Why does northern Africa have zero NPP? Why does south-central Asia have zero NPP?
3. Watch the region of the Amazon Basin in South America. Each year, there is a dry season when little precipitation falls, and it translates to a region of low NPP that always starts in the the middle of the continent and works its way northeast towards the mouth of the Amazon Basin. You will see this as a "white blob" that moves northeast across the middle section of the continent. What months comprise the 'dry season' for this portion of the continent?
