Understanding Climographs
A climograph is a figure that provides standard information about the climate of a city: its average (or mean) temperature and precipitation over the 12 months of the year. Climographs are very handy for quantitatively comparing the climates of cities to each other and for making observations about the climate of a city based on data instead of perceptions. For example, if you were planning a vacation, or a wedding, or other big event for the month of June, and had to decide between two cities for your destination, you might use climographs to help you see which city has less rain or more comfortable temperatures for that month.
Climographs are also useful for understanding whether the conditions experienced over several weeks are "normal" for that time of year. For example, if Coeur d'Alene has a heat wave in September, you can look at a climograph to see how much warmer than normal the temperatures for the month actually are in order to describe the intensity of the heat wave and better understand its effects. You can also use climographs to ask and answer questions about what factors influence the climatology of a city you may not know much about. Is it a city near an ocean? It is high in elevation? Is it in the middle of a desert? Surprisingly, you can tease out this type of information from a climograph. Gardners and landscapers use climograph information to help identify what plants are appropriate for an area. Most important for any business traveler or vacationer, climographs can help you decide what type of clothes to pack for your trip!
How do you read a climograph?
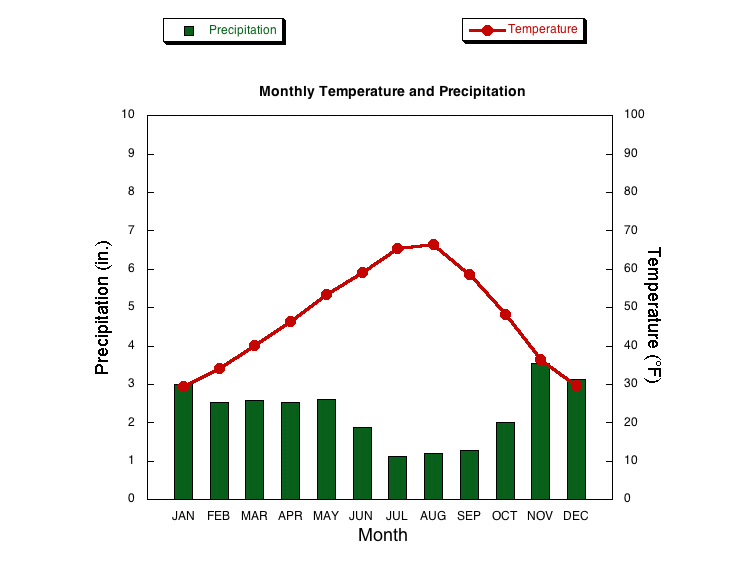
The climograph below shows the mean temperature and the mean monthly cumulative precipitation for Moscow, ID. This is a double y-axis climograph, where Precipitation totals for a given month are measured on the left y-axis (and represented by the bars), while the mean monthly Temperature is measured on the right y-axis and represented by a line. Months are listed across the x-axis. Often, climographs will have two temperature lines, one each for mean high and low temperatures for each month.
For Moscow, for example, the mean January temperature is only 30 degrees F, and the city receives and average of 3 inches of precipitation during January. Given the mean temperature, do you think this precipitation more likely falls as rain or as snow?
You can also calculate the total annual precipitation for a city from its climograph. You simply add up the monthly means. For Moscow, the mean annual precipitation is 27 inches.
Finally, you can tell that Moscow is an inland city (i.e., not next to a large body of water like an ocean) by the relatively large annual range in temperature. The monthly mean in the coldest month, December, is about 30 F, while the August mean is nearly 70 F. That range of nearly 40 degrees (warmest minus coldest) is a clue that this city is in an inland region away from the temperature-moderating oceans (although this is not always the case, as many cities along the New England Coast have simlar ranges in temperature).
Climographs are also useful for understanding whether the conditions experienced over several weeks are "normal" for that time of year. For example, if Coeur d'Alene has a heat wave in September, you can look at a climograph to see how much warmer than normal the temperatures for the month actually are in order to describe the intensity of the heat wave and better understand its effects. You can also use climographs to ask and answer questions about what factors influence the climatology of a city you may not know much about. Is it a city near an ocean? It is high in elevation? Is it in the middle of a desert? Surprisingly, you can tease out this type of information from a climograph. Gardners and landscapers use climograph information to help identify what plants are appropriate for an area. Most important for any business traveler or vacationer, climographs can help you decide what type of clothes to pack for your trip!
How do you read a climograph?
The climograph below shows the mean temperature and the mean monthly cumulative precipitation for Moscow, ID. This is a double y-axis climograph, where Precipitation totals for a given month are measured on the left y-axis (and represented by the bars), while the mean monthly Temperature is measured on the right y-axis and represented by a line. Months are listed across the x-axis. Often, climographs will have two temperature lines, one each for mean high and low temperatures for each month.
For Moscow, for example, the mean January temperature is only 30 degrees F, and the city receives and average of 3 inches of precipitation during January. Given the mean temperature, do you think this precipitation more likely falls as rain or as snow?
You can also calculate the total annual precipitation for a city from its climograph. You simply add up the monthly means. For Moscow, the mean annual precipitation is 27 inches.
Finally, you can tell that Moscow is an inland city (i.e., not next to a large body of water like an ocean) by the relatively large annual range in temperature. The monthly mean in the coldest month, December, is about 30 F, while the August mean is nearly 70 F. That range of nearly 40 degrees (warmest minus coldest) is a clue that this city is in an inland region away from the temperature-moderating oceans (although this is not always the case, as many cities along the New England Coast have simlar ranges in temperature).
Assignment
The Weather Channel provides a tool to plan your vacation by comparing climographs. On BBLearn, under Module 1, complete the short, multiple-choice "Assignment 1.4: Climograph Comparisons." Log into BBLearn and open the multiple choice assignment, and click on the button below (or the link in the assignment) to go to the Weather Channel climate comparison website in order to answer the questions and complete the assignment.
